
INTRODUCTION TO BIOSTATISTICS
- In the information age. this blog is about information :—
- how it is obtained,
- how it is analyzed,
- how it is interpreted.
- To begin with, raw information that is of concern to us is labelled as data.
- Data is available to us in the form of numbers.
- These numbers need to be processed to yield insights we call refined data or information.
- The objectives of this blog are:
- To teach the reader the skill of organising and summarizing data.
- Descriptive statistics.
- To enable the reader in reaching decisions about any amount of data by analysing only a part of it.
- Inferential statistics.
- To teach the reader the skill of organising and summarizing data.
Biostatistics – Concepts and terminology
- It is easy to get confused in statistics as it has its own vocabulary. Even familiar terms have a different meaning in statistics as compared to its day to day usage.
- Hence an initial familiarization with statistical terms becomes mandatory
IMPORTANT TERMS
Data
- It is the raw material in the world of statistics.
- Data is understood to be things known or assumed as facts, which provide the basis of reasoning or calculation.
- The two kinds of numbers that we use in statistics are numbers
- that result from the taking of any measurement,
- and those that result from the process of keeping a count.
- Each of the recorded numbers is a datum(singular).
- All records taken together are data (plural).
Statistics
- It is the practice or science of collection and analysis of numerical data in significant numbers to infer the proportions of a whole from which the representative sample is taken.
- Hence, statistics is a field of study concerned with
- Data collection, organization, summarization, and analysis
- Drawing inferences about a body of data from a representative sample of data.
- Simply put,
- data are recorded numbers,
- these numbers contain information,
- statistics investigate and evaluate recorded data to reveal this information and its meaning in the context of the study population.
Trends of Data
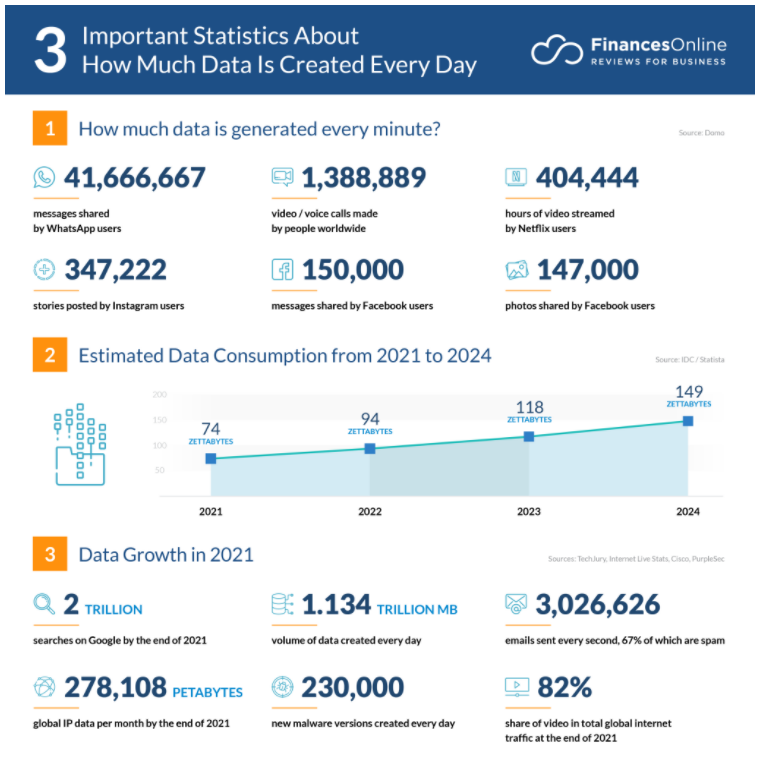
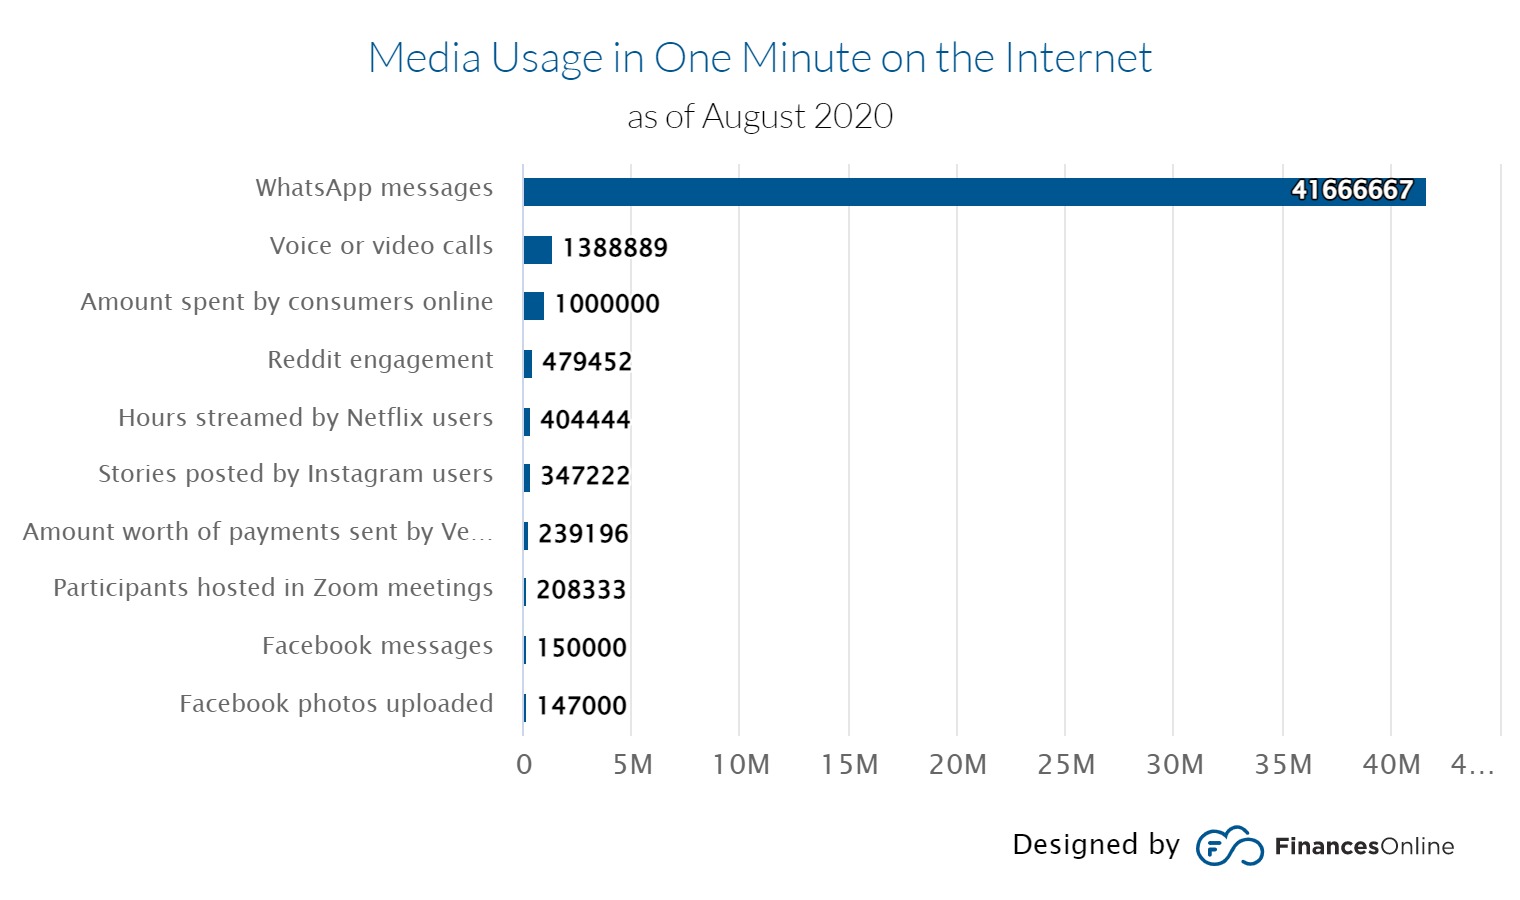
- Data Volume Creation and Consumption in the Future (IDC & Statista, 2020)
- The year 2022 – 94 zettabytes
- The year 2023 – 118 zettabytes
- The year 2024 – 149 zettabytes
- (1 zettabyte = 1000,000,000,000 GB)
- As of 2020, the average data consumption per user per month across 3G and 4G networks in India were 13462 megabytes. (Statista)
- Trends for big data generation are
- In comparison, conventional sources of data for medical use have been restricted to
- Routinely organisational records.
- Patient medical records – These are becoming increasingly important with the advent of digital electronic health records (EHR).
- Accounting records – More often than not, these are the best-kept records to be found.
- Survey records – for an objective assessment of subjective opinions and/or practices.
- Experimental observations – These are specifically important when the required data is peculiar to a given situation.
- External sources – These include:-
- Published reports,
- Commercially available data banks,
- Research literature
Biostatistics
- Simply put, it is the application of statistical tools and concepts in the field of biological sciences.
- Here the data are derived from biological sciences like medicine.
Variable
- a characteristic under observation that adopts different values under different circumstances
- Quantitative Variables
- Measurements made on quantitative variables convey information regarding the amount.
- Qualitative Variables
- Measurements made on qualitative variables convey information regarding
attribute or frequencies of counts.
- Measurements made on qualitative variables convey information regarding
- Quantitative Variables
Random Variable
- Here the values obtained for a variable are a result of chance because of which they cannot be exactly predicted in advance.
- Types
- Discrete Random Variable
- It is characterized by gaps or interruptions in the values which the variable can assume.
- Continuous Random Variable
- It does not possess any gaps or interruptions characteristic of a discrete random variable.
- Discrete Random Variable
- However, consequent to the limitations of measuring instruments, observations about variables that are inherently continuous are recorded as discrete.
Population
- defined as the largest collection of entities of interest at a particular time.
- Alternatively, defined as the largest collection of values of a random variable of interest at a given time.
- Populations are determined by a subjective sphere of interest
- Populations may either be finite or infinite.
Sample
- defined simply as a part of a population.
- It may be
- Representative sample
- Non-Representative sample
Research study
- It is a scientific study of a phenomenon of interest.
- Research studies entail
- designing sampling protocols,
- collecting and analyzing data,
- and providing valid conclusions based on the results of the analyses.
Experiments
- These are a special type of research study
- The observations are made after specific manipulations of conditions have been carried out
- They provide the foundation for scientific research.
MEASUREMENT AND MEASUREMENT SCALES
Measurement
- Defined as a system of
assignment of numbers
to objects or events
using a predetermined set of rules.
Types of measurement scales
The Nominal Scale
- This is considered the simplest and least scalable form of a measurement scale
- It entails “naming” observations
- It works by organising measurements into mutually exclusive and collectively exhaustive categories.
The Ordinal Scale
- Here in addition to recording observations in different categories, they are ranked according to predetermined criteria.
The Interval Scale
-
It is considered to be a more sophisticated scale than the nominal or ordinal scale.
-
Here the distance between any two measurements is known
-
this requires the use of an arbitrarily determined
- unit distance
- zero point
-
This means that the selected zero point is not necessarily a true zero (total absence of the quantity being measured).
The Ratio Scale
- It is widely considered to be the highest level of any measurement scale.
- Fundamental prerequisite for a ratio scale is a true zero point.
- This scale is characterized by the fact that it can determine
- equality of ratios
- equality of intervals
SAMPLING AND STATISTICAL INFERENCE
Statistical inference
: It is the procedure by which we reach a conclusion about a population on the basis of the information drawn from a sample that has been drawn from that population.
- To make a valid inference about a population, scientific samples need to be drawn from the population.
- There are also many kinds of scientific samples – the simplest of these is the simple random sample.
Simple random sample :
If a sample of size n is drawn from a population of size N in such a way that every possible sample of size n has the same chance of being selected, the sample is called a simple random sample. - To ensure true randomness of the selection, some objective procedure needs to be followed.
-
Types of procedures for simple random sampling:
- Sample with replacement: Here every member of the population is available at
each draw. - Sample without replacement : As the sampled members are removed from the population for subsequent sampling, observations could be recorded from them only once.
- Sample with replacement: Here every member of the population is available at
-
In practice, sampling is always done without replacement.
Leave a Reply